By Cylinder
Trend Line
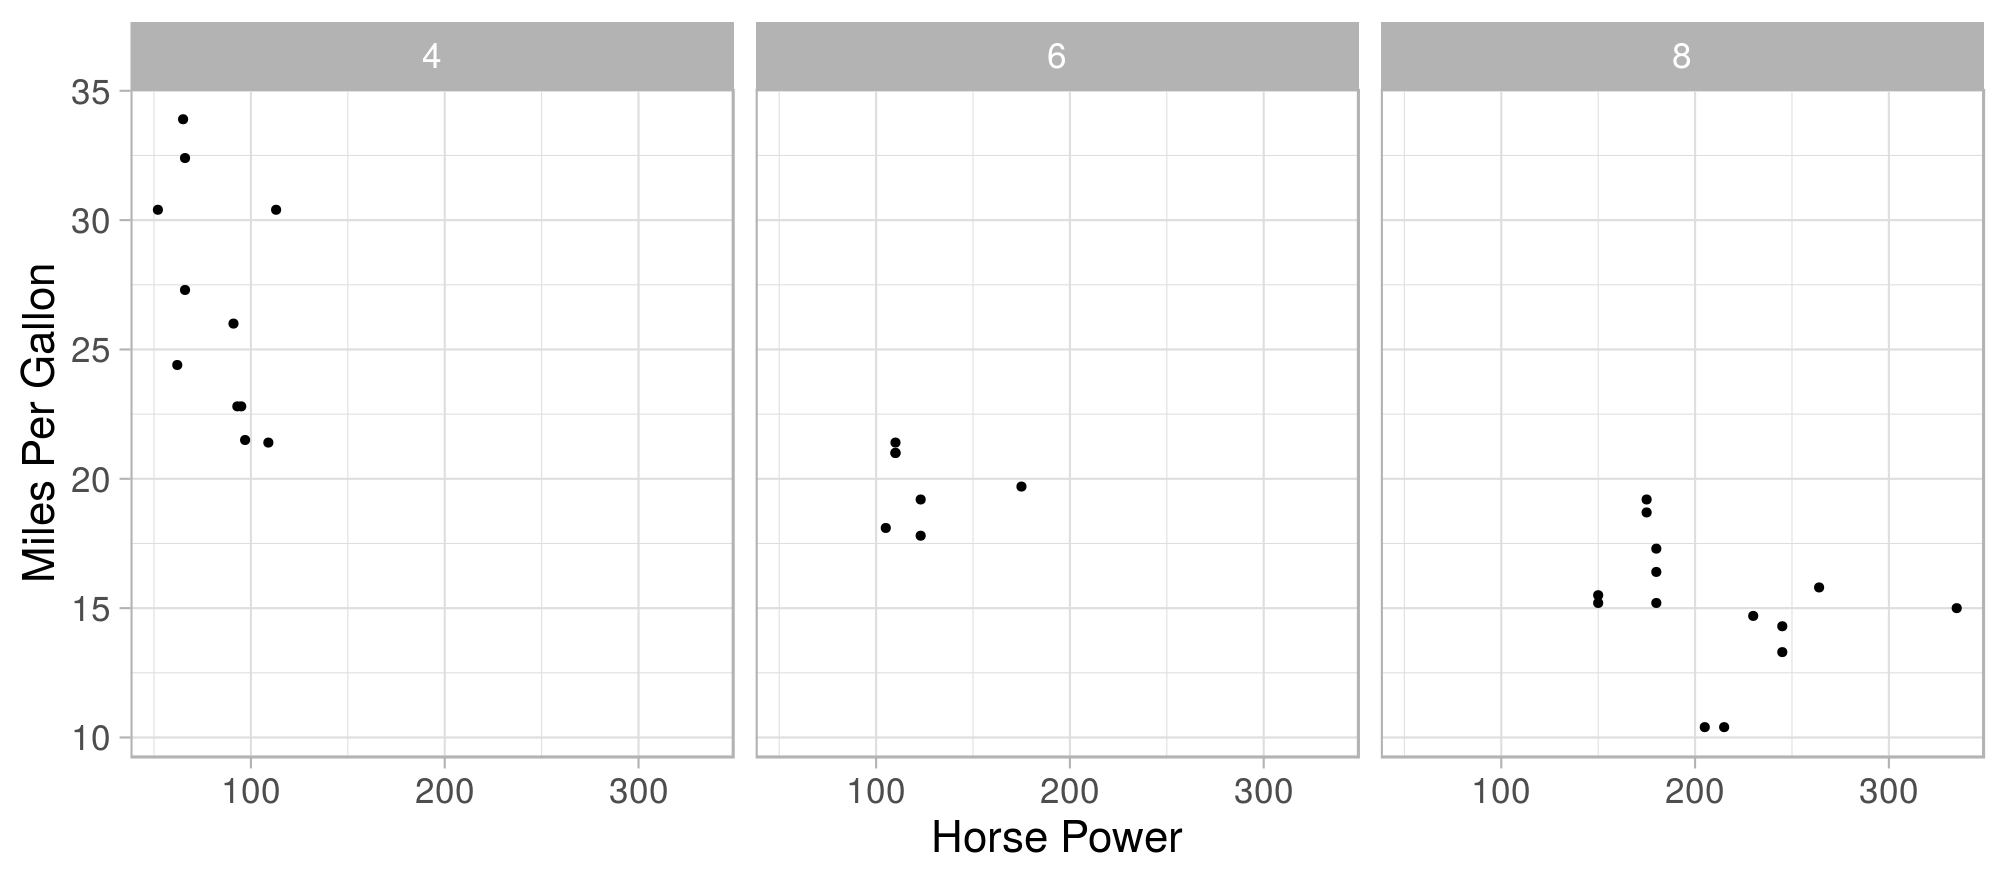
Power vs Efficiency
material_page(
  title = "shinymaterial",
  tags$br(),
  material_row(
    material_column(
      width = 2,
      material_card(
        title = "",
        depth = 4,
        tags$p("By Cylinder"),
        material_switch(
          input_id = "facet_cyl",
          off_label = "No",
          on_label = "Yes",
          initial_value = TRUE
        ),
        tags$p("Include Trend Line"),
        material_switch(
          input_id = "trend_line",
          off_label = "No",
          on_label = "Yes"
        ),
        material_radio_button(
          input_id = "plot_theme",
          label = "Theme",
          choices =
            c("Light" = "light",
              "Dark" = "dark")
        )
      )
    ),
    material_column(
      width = 9,
      material_card(
        title = "Power vs Efficiency",
        depth = 4,
        plotOutput("mtcars_plot")
      )
    )
  )
)function(input, output) {
output$mtcars_plot <- renderPlot({
plot_output <-
ggplot(
mtcars,
aes(
x = hp,
y = mpg
)
) +
xlab("Horse Power") +
ylab("Miles Per Gallon") +
geom_point() +
theme(
text = element_text(size = 16)
)
if(input$facet_cyl){
plot_output <-
plot_output +
facet_wrap(
"cyl"
)
}
if(input$trend_line){
plot_output <-
plot_output +
stat_smooth(
method = "lm",
se = FALSE
)
}
if(input$plot_theme == "light"){
plot_output <-
plot_output +
theme_light(base_size = 20)
} else if(input$plot_theme == "dark"){
plot_output <-
plot_output +
theme_dark(base_size = 20)
}
plot_output
})
}